

In this tutorial we are going to graph CVE numbers over time using the Forward API, a python script and some open-source tool. Why would you want to do this? In summary, your boss wants to see PROGRESS! He wants to see progress towards expunging CVEs from network devices. He’s a simple guy and likes a graph. Let’s see how we can go about this.
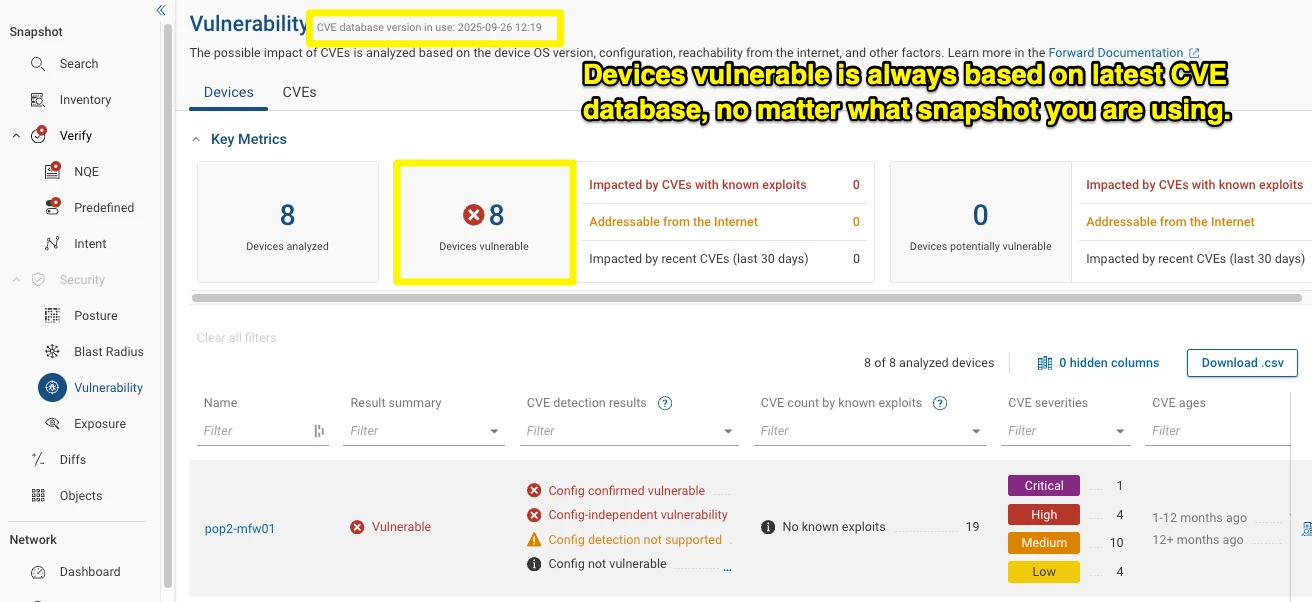
At the time of writing (release 25.9) Forward Enterprise’s CVE count is based on the current CVE database. If you pull up a snapshot from a month ago, the snapshot is compared with today’s CVE database. So going back to the vulnerability pages on old snapshots will not allow you to see how many CVEs you’ve squashed as a result of all those late-night maintenance windows.
In the screenshot below we can see that 8 devices are vulnerable:
To solve this conundrum we need to pull data out of the API into another application for storage and graphing. We are going to use:
- Prometheus - a ‘time-series’ database
- Grafana - an observability tool. (That’s dashboards to you and me)
Grafana produces good-looking dashboards and graphs, but has no way to store data. For that you need a time-series database, and Prometheus is what we will be using here. Other options are available, such as InfluxDB.
Prometheus can pull metrics from systems that present data in a Prometheus format, but it cannot pull metrics from a REST API. For this, we need a Python script to query the Forward API and convert the data retrieved into Prometheus telemetry.
The API alone can’t give us the metrics we need, so we will write an NQE script to do that. The NQE will run every time the Python script it makes a REST call to the API.
The stack in use looks like this:
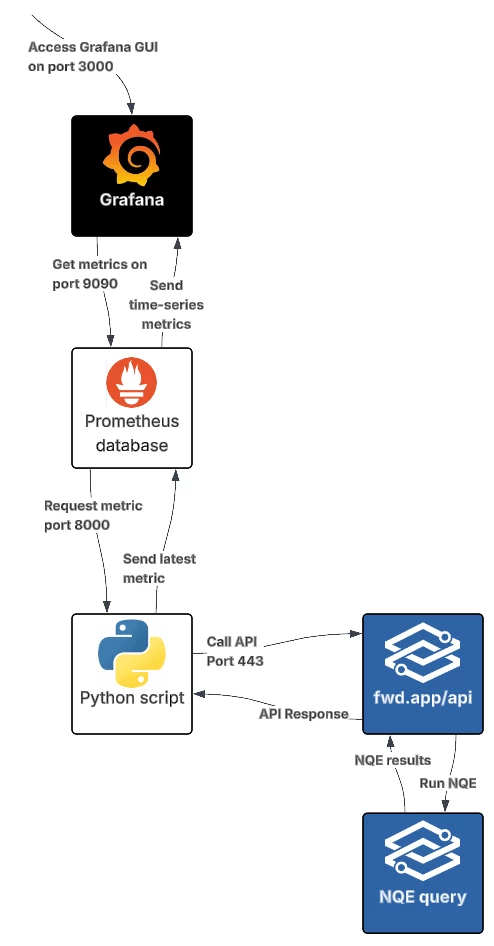
Prometheus
Install Prometheus:
 apt install prometheus
 sudo systemctl start prometheus
You need to configure Prometheus to ‘scrape’ data from somewhere. Edit the Prometheus config:
sudo vim /etc/prometheus/prometheus.ymlIn this file you will find a scrape_configs section with a job called prometheus already configured. This means that by default Prometheus scrapes its own metrics and serves them on port 9090.
Our Python script will run on the same machine as Prometheus, so let us specify localhost and a port number to scrape from. Insert a second job_name in the scrape_configs section. Call this one exporter and use a different port on localhost:
scrape_configs:
  - job_name: 'prometheus'
    static_configs:
      - targets: ['localhost:9090']
  - job_name: exporter
    static_configs:
      - targets: ['localhost:8000']
Restart Prometheus:
sudo systemctl restart prometheus
Grafana
Install Grafana using these instructions:
https://grafana.com/docs/grafana/latest/setup-grafana/installation/debian/
In /etc/grafana/grafana.ini I enabled just HTTP on port 3000 for simplicity. Don’t judge me.
[server]
# Protocol (http, https, h2, socket)
protocol = http

# The http port to use
http_port = 3000
Start Grafana:
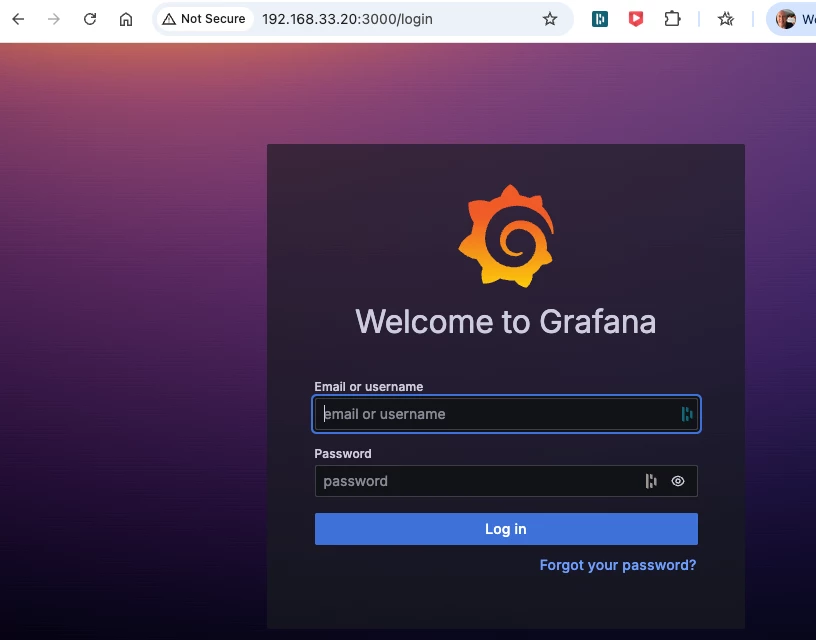
systemctl start grafana-serverAt this point you should be able to browse to the server on port 3000 and see a Grafana login.
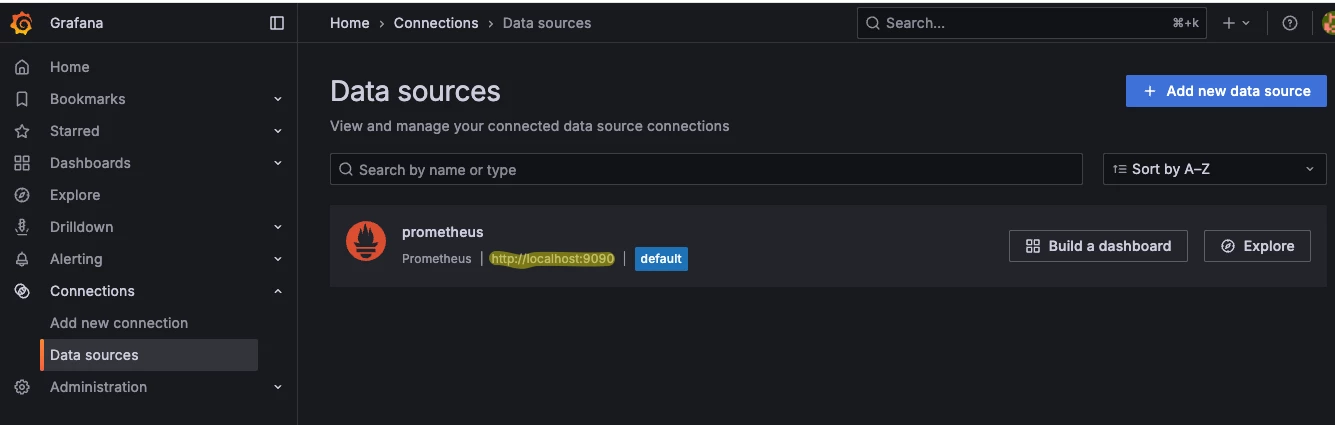
Log in and add a new Data Source under Connections. Prometheus can be queried on port 9090 for metrics about itself - this is a good way to test if Grafana and Prometheus can talk:
Next, create a new dashboard which should have Prometheus selected as the default source. Search for node_scrape_collector_duration_seconds in the metrics drop-down, then click to run the query. If you see a graph, then Grafana is successfully getting data from Prometheus:
Write the NQE
We are going to use an NQE script to tally the number of vulnerabilities there are of each severity on the network.
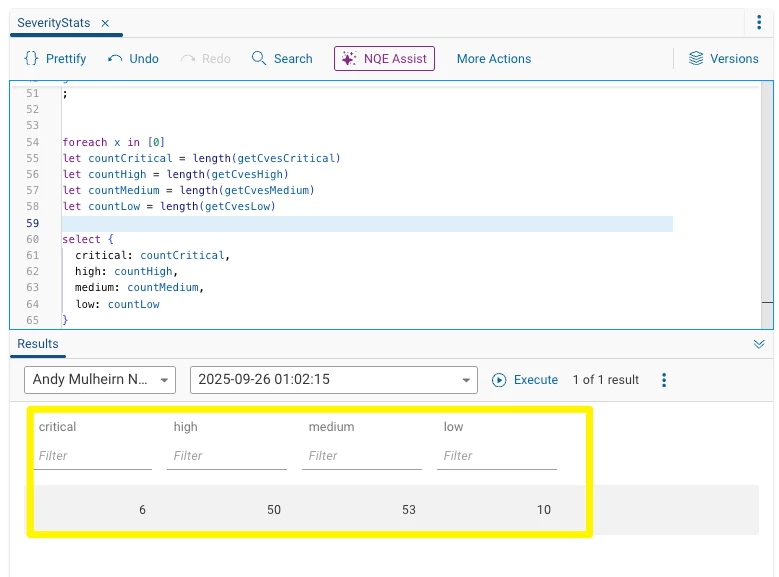
As you can see, it produces a raw count of each. Basic, but that’s what the boss needs.
Here is the code - there may be a more efficient way to write this:
getDevicesAffected(cve) =
  foreach device in network.devices
  foreach cveFinding in device.cveFindings
  where cve.cveId == cveFinding.cveId
  where cveFinding.isVulnerable == true
  select cveFinding.cveId
;

getCvesCritical =
  foreach cveDatabase in [network.cveDatabase]
  foreach cve in cveDatabase.cves
  foreach vendorInfo in cve.vendorInfos
  where vendorInfo.severity == Severity.CRITICAL
  let devicecount = getDevicesAffected(cve)
  where length(devicecount) > 0
  select distinct {cve: cve.cveId}
;

getCvesHigh =
  foreach cveDatabase in [network.cveDatabase]
  foreach cve in cveDatabase.cves
  foreach vendorInfo in cve.vendorInfos
  where vendorInfo.severity == Severity.HIGH
  let devicecount = getDevicesAffected(cve)
  where length(devicecount) > 0
  select distinct {cve: cve.cveId}
;


getCvesMedium =
  foreach cveDatabase in [network.cveDatabase]
  foreach cve in cveDatabase.cves
  foreach vendorInfo in cve.vendorInfos
  where vendorInfo.severity == Severity.MEDIUM
  let devicecount = getDevicesAffected(cve)
  where length(devicecount) > 0
  select distinct {cve: cve.cveId}
;


getCvesLow =
  foreach cveDatabase in [network.cveDatabase]
  foreach cve in cveDatabase.cves
  foreach vendorInfo in cve.vendorInfos
  where vendorInfo.severity == Severity.LOW
  let devicecount = getDevicesAffected(cve)
  where length(devicecount) > 0
  select distinct {cve: cve.cveId}
;


foreach x in [0]
let countCritical = length(getCvesCritical)
let countHigh = length(getCvesHigh)
let countMedium = length(getCvesMedium)
let countLow = length(getCvesLow)

select {
  critical: countCritical,
  high: countHigh,
  medium: countMedium,
  low: countLow
}
Make sure you commit your query in the NQE Library.
Calling the NQE by API
To call this NQE via the API you need three things:
• API credentials (key and secret)
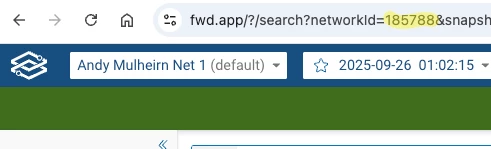
• The Network ID
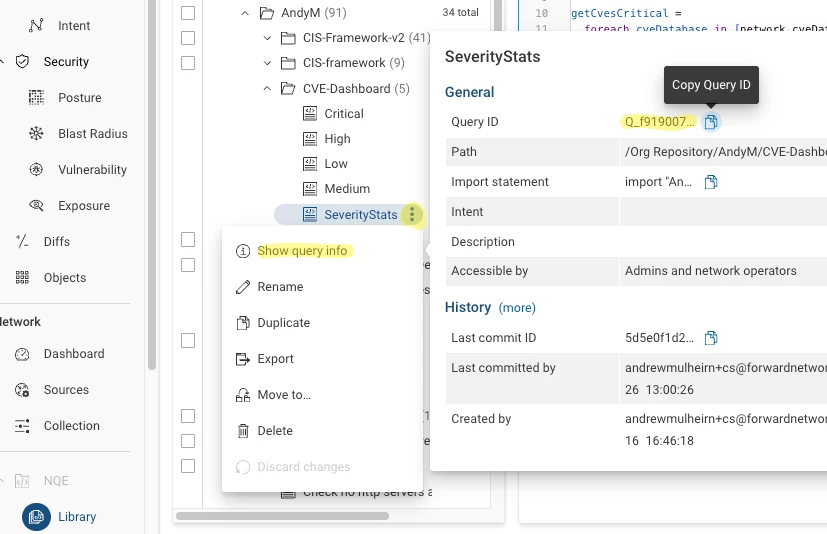
• The Query ID of the NQE you just wrote above
I assume you already have an API access key and token, but if not you can create one in fwd.app under Settings | Personal | Account.
Your Network ID is in the URL bar of your browser:
Your Query ID can be found by clicking the three dots next to the query, opening Query Info and copying the Query ID. If you forgot to commit your query, this ID will not be present:
Once you have these three things, you can use a tool like Postman to send a post to the API endpoint. Alternatively, you can use cURL (instructions below).
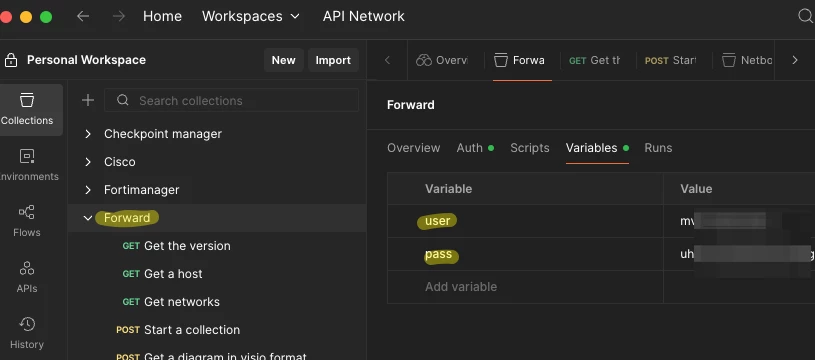
In Postman, make a directory called Forward and set two variables up to contain your API key ID and secret - call these user and pass:
Now in the Auth tab, select Basic Auth, and put user and pass in double curly brackets like this:
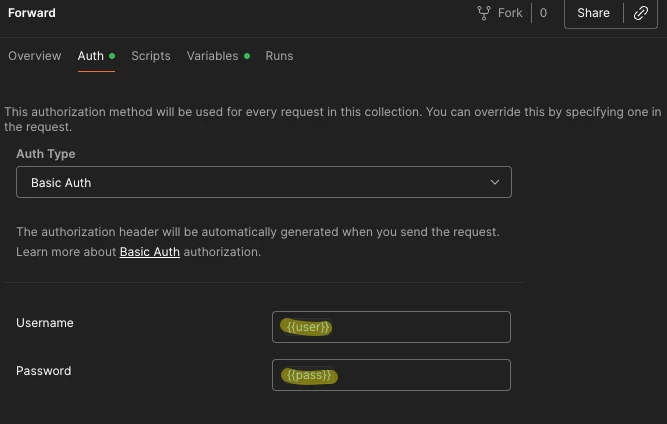
Now you’ve done the above steps, any API calls you write in the Forward folder will inherit the username and password from the parent folder. If you change the username or password it only needs to be changed in that one place for all scripts to get the new values.
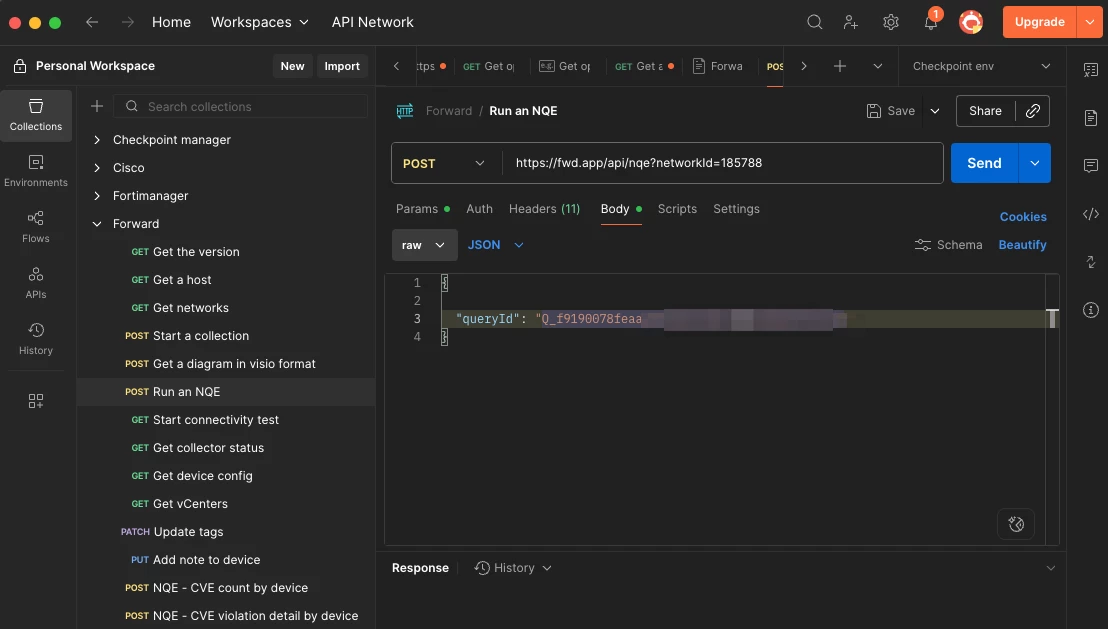
We are ready to make a test API call. Add a POST request to the Forward folder using https://fwd.app/api/nqe?networkId=<YOURNETWORKID> as the endpoint. As you can see below, I put queryId in the body of the post:
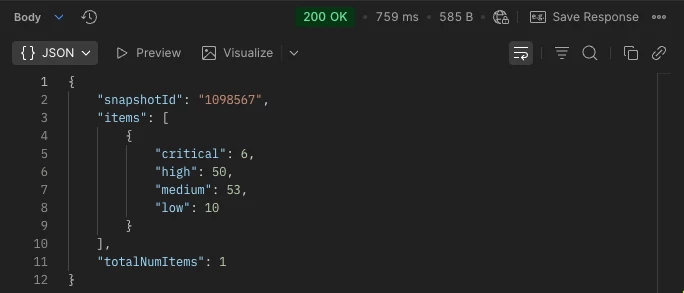
Click send and you should get a 200 OK message with a JSON response. The values for critical, high, medium and low are exactly the same as what we saw in the GUI earlier - as you might expect:
cURL - Alternative to Postman
If you don’t want to use Postman, you can achieve the same with cURL:
curl --location 'https://fwd.app/api/nqe?networkId=<YOUR NETWORK ID HERE>' \
--header 'Accept: application/json' \
--header 'Content-Type: application/json' \
--header 'Authorization: ••••••' \
--data '{
  "queryId": "<YOUR QUERY ID HERE>"
}'
Write the Script
What remains to be done is to retrieve data from the Forward API automatically and turn it into Prometheus metrics.
Set up your Ubuntu host with a python venv in which we will run our exporter:
mkdir prometheus-exporter
cd prometheus-exporter
apt update
apt install python3
apt install pip
pip install virtualenv
apt install python3.10-venv
python3 -m venv venv
source venv/bin/activate
pip install prometheus_client requests
Using vim the editor of your choice, create the script as below:
from prometheus_client import start_http_server, Gauge
import requests
import time
import json

headers = {
        "Authorization": "<YOUR BASIC AUTH HERE>",
        "accept": "application/json",
        "Content-Type": "application/json"
        }

url = "https://fwd.app/api/nqe?networkId=<YOUR NETWORK ID HERE>"

# Turn a python string into JSON
payload = json.dumps({
  "queryId": "<YOUR QUERY ID HERE>"
})


# Create Prometheus Gauge metrics for each value
critical_gauge = Gauge('critical_value', 'Value fetched from REST API')
high_gauge = Gauge('high_value', 'Value fetched from REST API')
medium_gauge = Gauge('medium_value', 'Value fetched from REST API')
low_gauge = Gauge('low_value', 'Value fetched from REST API')

def fetch_and_update():
    try:
        # Use requests to send a POST to the URL with the payload
        response = requests.post(url, headers=headers, data=payload)
        response.raise_for_status()
        data = response.json()

        # Extract the values you want as integers
        criticalValue = int(data['items'][0]['critical'])
        highValue = int(data['items'][0]['high'])
        mediumValue = int(data['items'][0]['medium'])
        lowValue = int(data['items'][0]['low'])

        # Update Prometheus metrics
        critical_gauge.set(criticalValue)
        high_gauge.set(highValue)
        medium_gauge.set(mediumValue)
        low_gauge.set(lowValue)
        print(criticalValue, highValue, mediumValue, lowValue)

    except Exception as e:
        print(f"Error fetching or parsing API response: {e}")

if __name__ == '__main__':
    # Start the HTTP server to expose metrics to Prometheus
    start_http_server(8000)
    print("Exporter running on port 8000...")

    # Poll the API every 30 seconds
    while True:
        fetch_and_update()
        time.sleep(30)
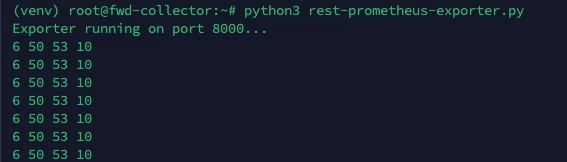
When you run the script you should see a message to say it is running, and every 30 seconds a set of statistics will appear:
Make the Grafana Dashboard
Go back to Grafana again and this time we will make a dashboard to show those metrics on a chart.
Add a new dashboard and add a visualisation into it. Initially you will have no data, but there will be a query called A at the bottom of the screen. Search for the critical_value metric, and choose the exporter job. Click to run the query and you should see some data:
Add another query at the bottom, this time selecting high_value. Repeat for medium and low.
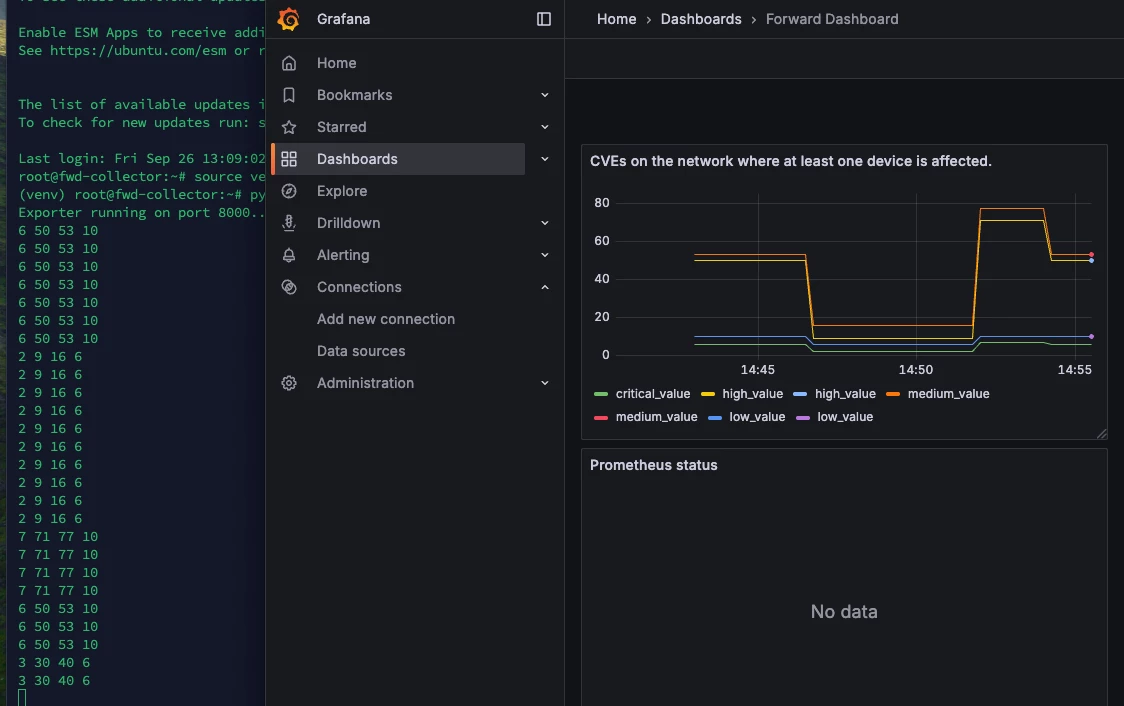
At this point you should have four lines on the graph. To make this more than just a flat line, I switched off a few devices in my lab, ran a collection, then switched them back on - as you can see, the counters changed as I did so:
Summary
While the Forward dashboard doesn’t allow you to graph CVEs over time, using the API is a great way to extract this information. Many organisations already have Grafana as an observability tool so, so integrating Forward data into that makes a lot of sense.

