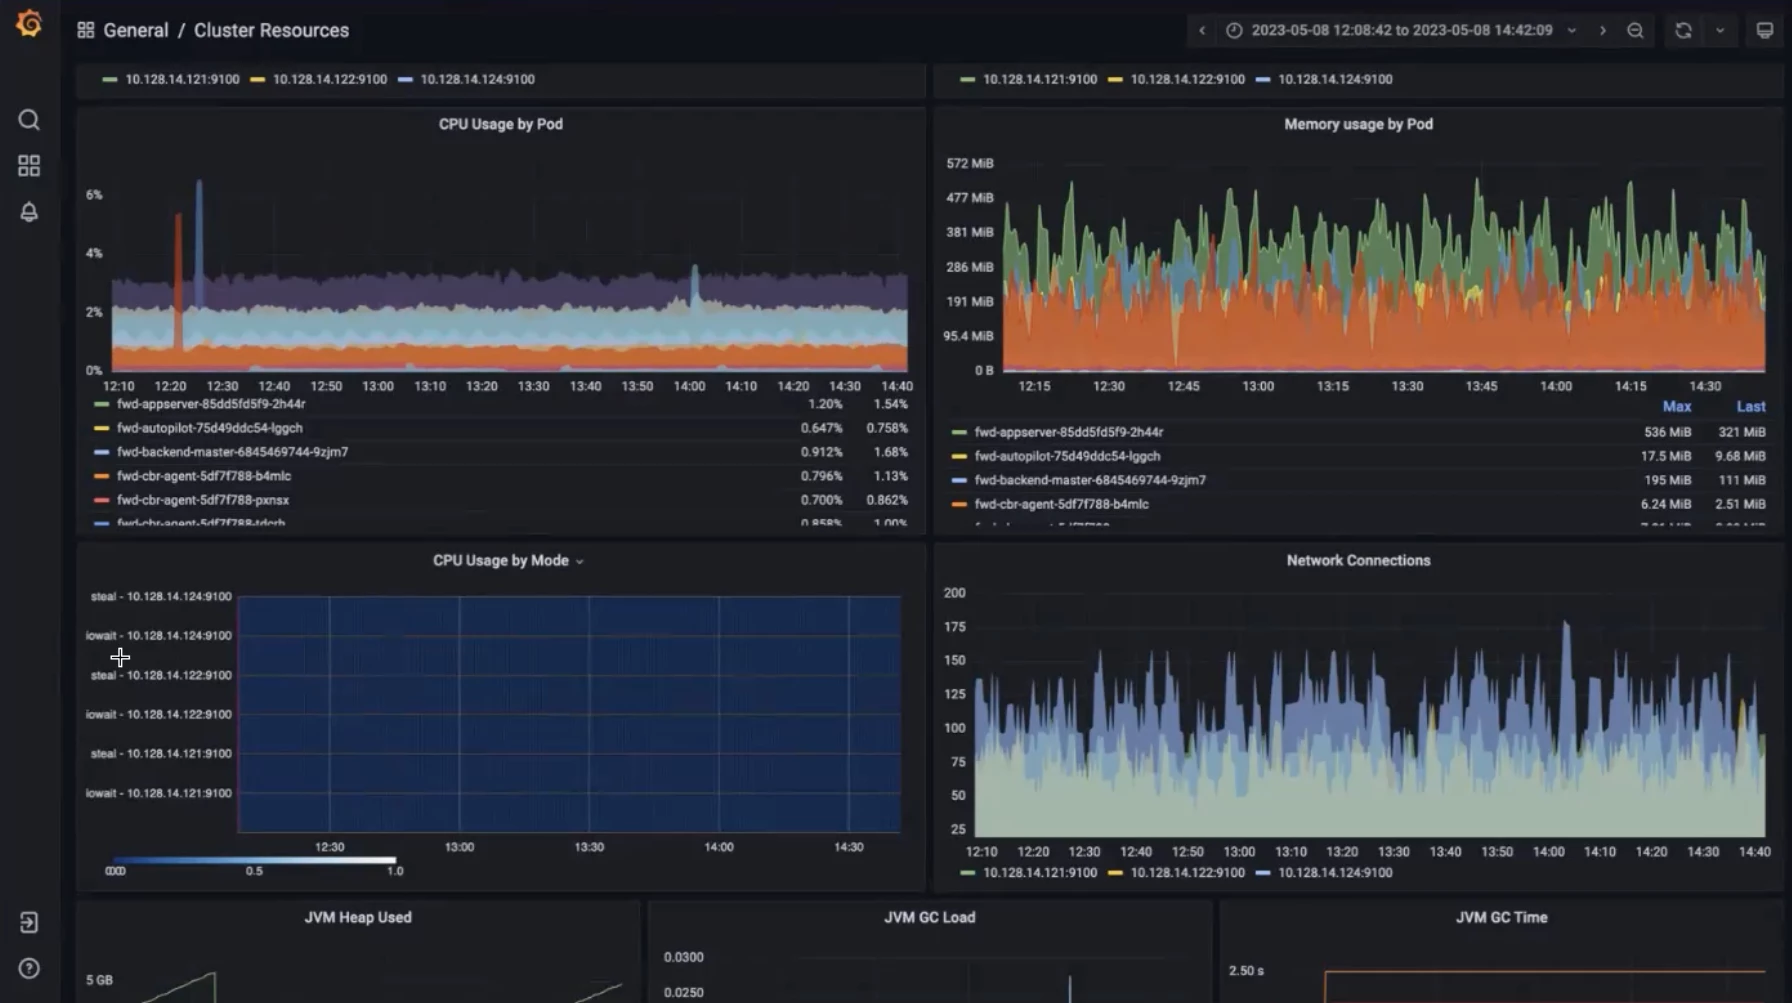
To monitor the health of the cluster and its instances, Forward provides a configurable Dashboard based on Grafana available at https://<PRIMARY_NODE_IP>/monitoring.. The release 23.5 introduces several improvements that aim at providing an easier to consume and to understand dashboard centered around the pods' resources instead of single containers.