
In Inventory, you have probably noticed how some table columns make it easy to spot issues at a glance. Green means things are healthy and red means something needs attention. The Status column in the Network devices table, located in Inventory, is a good example: “processed” shows up in green while something like “connection refused” stands out in red.
Now, you can bring the same visual feedback into your own NQE queries.
We’ve added a new builtin called withInfoStatus. It lets you tag any value in your result table with a label: OK, WARNING, or ERROR. The results table uses that label to color values appropriately.
Here is an example. Suppose you want to flag devices whose OS support has already ended. This query checks if the support date is in the past and then labels it.
foreach device in network.devices
let platform = device.platform
let osSupport = platform.osSupport
where isPresent(osSupport) && isPresent(device.snapshotInfo.collectionTime)
let collectionDate = date(device.snapshotInfo.collectionTime)
select {
  Device: device.name,
  Vendor: platform.vendor,
  Model: platform.model,
  OS: platform.os,
  "End of OS support":  withInfoStatus(osSupport.lastSupportDate,
    if osSupport.lastSupportDate < collectionDate
    then InfoStatus.ERROR
    else InfoStatus.OK)
}
The column “End of OS support” in the table below shows how the styling appears after the query is run:
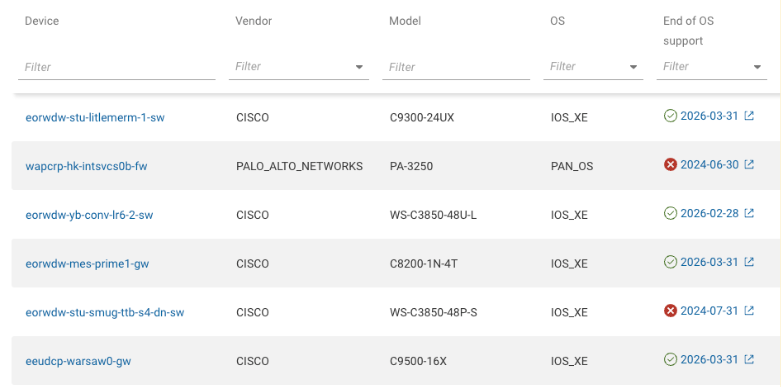
When you run this, expired dates show up in red and current ones in green. The filter dropdown for that column will reflect the same color styling, making it easy to isolate devices with expired support.
This works with strings, numbers, IPs, dates, timestamps, and a few others.
This feature was released in 25.5.0 and is controlled by the OrgProperty.NQE_INFO_STATUS flag. If you are not seeing this behavior yet, check with your Forward contact to confirm whether it’s enabled for your org.
Questions? Ask below

