

Ok, so you make all your configs using Ansible or Netbox Config Templates and are feeling good that you’ve got a consistent configuration everywhere - nice! Having a solid templating system to produce standardized configs is a great first step. But once the devices have been made live on the network, how can we run in-life tests to make sure their configurations have not drifted away from the ‘golden’ one they started out with?
Two general approaches might be used for this:
- Regenerate configs periodically and compare them with the live config.
- Write specific tests for parts of the configuration (security hardening measures for example) and leave the remainder unchecked.
Option 1 is a fairly simple approach - run ansible playbooks to generate configs as a cron job. Then write a python script to diff the generated and live configs to report on the difference. Simple approaches usually come with drawbacks though. A few examples of the complexities with this option:
- a Junos config always has a ‘last commit time’ at the top which isn’t in the generated config, so that has to be worked around.
- A FortiOS device generates an snmp-index number automatically for each interface and a UUID for each firewall policy - again these aren’t part of the generated config coming out of the Ansible playbook.
Option 2 is a more targeted approach but requires more effort to write specific tests. Once written, these can be run within Forward Enterprise every time a collection occurs. Better than that, Forward can also be used to create a dashboard of pass/fail percentages using that data. You can drill down from the management pie-chart view to the lower level data very easily.
In this article, we are going to cover the following things:
- A skeleton test framework into which you can put your test cases.
- Incorporating region-specific variables such as AAA server or logging server
- Making the tests into NQE Verifications.
- Creating a scorecard with KPIs showing compliance.
The Framework
At the end of this article, I’ve attached a basic version of the framework with some Arista tests and some templates for you to use. Import it into your NQE library and customize it with your own regions and variables.
Here is the folder structure of the framework.
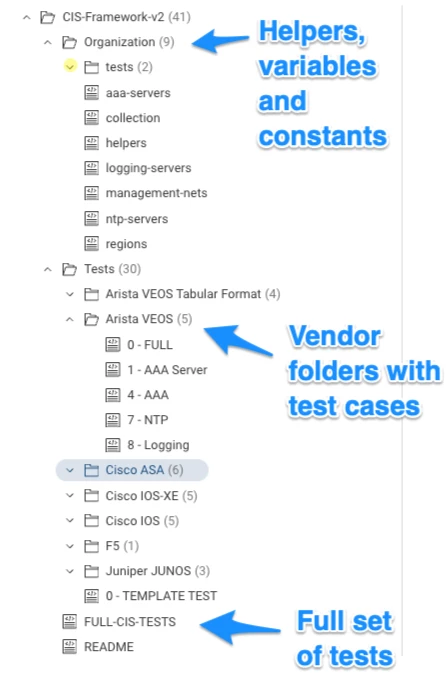
- Under the organization folder, we have variables and helpers. Management networks are probably constant values, while logging and AAA servers might be different by region.
- In the Tests folder there are vendor-specific (or in Cisco’s case, OS-specific) folders.
- Each vendor folder has a series of scripts with identifying numbers
- Also in the vendor folders is a FULL script which imports all the test cases and produces a big report for that vendor or OS
- Finally, at the top level there is a FULL-CIS-TESTS script which imports all the FULL tests from each vendor so that you can produce a report on all devices.
Regional Variations
Determining a Device’s Region
For various reasons, configuration variables may differ for devices in different locations. To accommodate this, we need to work out what ‘region’ a device is in. Assuming the network has a consistent naming convention we can use characters from a device name to determine the region.
Unsurprisingly we use a helper called ‘regions’ to do this:
// Helper for other functions that need to know what a device's
// region is (e.g. choosing the right ntp or tacacs server).
// If device name has a prefix with a certain pattern, set its
// region.
export get_region(device: Device) =
  if toUpperCase(prefix(device.name, 2)) in
     ["GB", "FR", "DE", "BE", "PL", "ES", "pop"]
  then "EMEA"
  else if toUpperCase(prefix(device.name, 2)) in ["JP", "CN", "TW"]
       then "APAC"
       else "AMER";
The above helper has an export function called get_region which takes a device as an input. We convert the device’s name to upper case and compare the first two characters against a list of ISO country codes. We use prefix to do this matching. If there is a match, the function returns the region, which will be either EMEA, APAC or AMER.
This helper can be imported into other scripts multiple times. If you need to change the list of country codes, you then only need to do that in the helper file. Handy, eh?
If you don’t have a good naming convention you could use tagging to assign devices to regions instead, then adjust the helper to match the tags instead of the hostname’s prefix.
Changing Variables Based on Region
Next let us look at the ntp servers helper:
/**
* @intent helper for NTP server info
* @description
*/

// valid individual ntp servers
export ntp_server_amer = [ipAddress("216.239.35.0")];

export ntp_server_emea = [ipAddress("216.239.35.0")];

export ntp_server_apac = [ipAddress("1.2.3.4"), ipAddress("5.6.7.8")];

export ntp_server_none = [ipAddress("0.0.0.0")];
There are four lists of IP addresses here, one for each region, each exported with a name that reflects that region. Again, this can be imported into your Cisco tests, your Arista tests and your Juniper tests - and any change made in the helper is reflected in those tests without you needing to modify them.
Note: It is likely that there will be multiple NTP servers, even though I only show one for America and EMEA regions in the example above
Knowing the Collection State
If we are checking for compliance, what do we do about devices that can’t be reached due to outage or maintenance? We can’t collect from them so we don’t know what their state is.
This is a function that all tests need, so we have it as a helper called ‘collection’:
/**
 * @intent Utilities related to collection
 * @description
 */

/*-------------------------------------------------------
isCollectedDevice - Exported function
Takes:    <device>
Returns:  <boolean>
-------------------------------------------------------*/

export isCollectedDevice(device: Device) : Bool =
  if !isPresent(device?.snapshotInfo)
  then false
  else when device?.snapshotInfo?.result is
      collectionFailed(deviceCollectionErrorData) -> false;
      processingFailed(deviceProcessingError) -> false;
      otherwise -> true;
Note: I learned this method of documenting exported functions from a customer. If you want others to re-use your code instead of reinventing the wheel, then good comments are a must.
Anatomy of a test
Now we have the region and what NTP servers are in that region, we can look at a test for NTP on an Arista device.
Imports
First we need to import the helper scripts:
/**
 * @intent Check NTP is configured for valid servers
 * @description
 */

/** --------- IMPORT HELPERS HERE  -------------------- **/
import "AndyM/CIS-Framework-v2/Organization/ntp-servers";
import "AndyM/CIS-Framework-v2/Organization/regions";
import "AndyM/CIS-Framework-v2/Organization/collection";
As you can see, I am importing the ntp-servers, regions and collection helpers.
Pattern Matching
Next comes the pattern we want to match on. In this example, we are looking for the exact words ‘ntp server’ followed by an IP address, which we store in a variable called ‘server’:
/** --------- PUT MATCH PATTERN HERE  -------------------- **/
pattern=```
ntp server {server:ipv4Address}
```;
Function
Next we create an exported function to contain the test. We export it because we want to run it in the FULL script later.
We also call the function from the end of the test case script so that it can be run individually for debugging purposes. Here’s the high-level structure:
export test01=
foreach device in network.devices
   //  the rest of your code and select statement here
;

test01      // calls the function above
Note: The exported test names all have to be unique if you are going to call them from the FULL script. It is a good idea to name them to match any internal standards documents you may have.
Here’s the actual NTP test. In the first part, we look for EOS devices, get their collection state, region and NTP servers. Then we diff the config against the pattern we expect to find.:
export seven=
foreach device in network.devices

// Check for collection failure
let collectionStatus = getCollectionStatus(device)

// Filter for EOS devices only
where device.platform.os == OS.ARISTA_EOS

// Get the region the device is in using the helper function
let region = get_region(device)


// Set the correctNtpServer based on the value of region
let correctNtpServer = if matches(region, "AMER") then ntp_server_amer
                        else if region == "APAC" then ntp_server_apac
                        else if region == "EMEA" then ntp_server_emea
                        else [ipAddress("0.0.0.0")]

// blockDiff the collected config against the pattern we expect
let diff = blockDiff(device.files.config, pattern)
In this next section, we look for matches. The logic is this:
- When a server in correctNtpServers matches one in the device’s config, we put that in matchedServer
- When a server in correctNtpServers does not match anything in the config, we store that in missing
- When a server exists in the config but doesn’t match anything in correctNtpServers, we store that in unmatched.
// look for matches between config and pattern
let match = (foreach match in blockMatches(device.files.config, pattern)
            select match.data.server)

// look for matches between correctNtpServer and what we found in the config (match)
let matchedServer = (foreach server in correctNtpServer
                    where server in match
                    select server)

// Find cases where no ntp servers from correctNtpServer are configured
let missing = (foreach server in correctNtpServer
                where server not in match
                select server)

// find unexpected NTP servers by subtracting what we found to match from
// what the correct server list should be, leaving unexpected entries.
let unmatched = (foreach server in match
                where server not in correctNtpServer
                select server)

// violation if we could not collect from the device to test compliance
// violation if there are servers configured that are not in correctNtpServer
// violation if correctNtpServer addresses are not configured
let violation = collectionFailed == "Failed" ||
                length(unmatched) != 0 ||
                length(missing) != 0
At the bottom of the section we set a variable called violation if the collection failed, or if there were any unmatched or missing servers. We simply check the length of unmatched and missing variables to determine if there is anything in them. Rudimentary, but it works.
Exceptions
The power of this framework is that it can tell you exactly what to change in order to make a device compliant again. There is no need to go and check old design documents that may or may not be up to date. It requires some work to create all the exception reasons, but it is worth it.
/** --------- EXCEPTION REASONS HERE  -------------------- **/

let diagnostic = if !isCollectedDevice(device)

  then [withInfoStatus("Device not collected - can't verify",
       InfoStatus.WARNING]

  else if correctNtpServer == [ipAddress("0.0.0.0")]
       then [withInfoStatus("Regional Servers Not Found",
            InfoStatus.WARNING)]

  else if !violation
       then (foreach server in matchedServer select
           withInfoStatus(toString(server) + " - COMPLIANT -",
           InfoStatus.OK))

  else
  (foreach server in missing select
    withInfoStatus(toString(server) + " - is missing -",
    InfoStatus.ERROR)) +

  (foreach server in unmatched select
    withInfoStatus(toString(server) + " - is incorrect-",
    InfoStatus.ERROR))
In the script section above, we create a variable called diagnostic.
The first check uses the isCollectedDevice function we imported from the collection helper. We negate it using !isColllectedDevice. The function returns true or false - if it is false then the device was not collected. We print some helpful information and colour the text using the InfoStatus function to flag it as a warning in amber.
The second check is a catch all in case a device is not matched to a region. If that is the case, correctNtpServers has all-zeroes in it. In that case we also print a warning.
In the third check we mark the device as compliant if there was no violation (!violation). InfoStatus.OK makes this message green.
In the fourth check, we flag up error messages in red. We print all the servers missing from the config that were expected, and also the servers found in the config that were not expected.
Report
Finally, let’s create the report.
Note: it is very important to have standard fields in this report so that the FULL script can import all the test cases. If you need to add in extra data, do that in the FULL script, keeping the test cases as simple as possible.
select {

    violation,

    deviceName:device.name,

    reference: "NTP ",

    result: diagnostic,

    diff: toString(diff.blocks),

    priority: "HIGH",

    external_reference: "https://workbench.cisecurity.org/sections/1130773/recommendations/1845574",

    name: device

};

seven
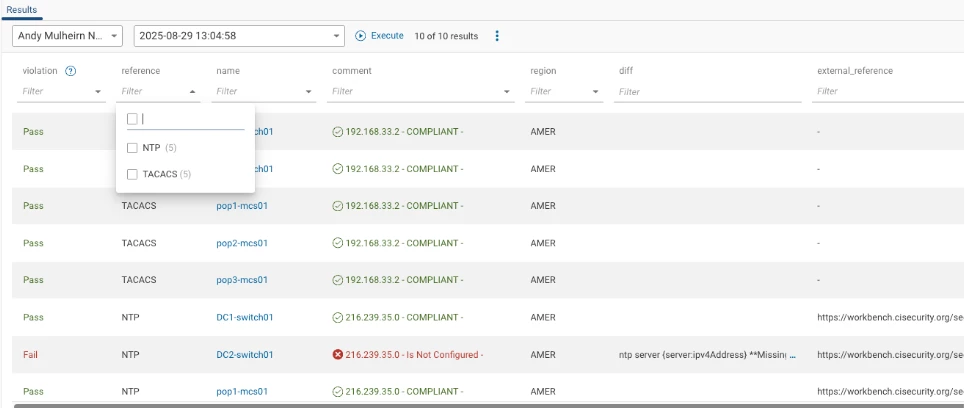
This report prints the devicename, an internal reference to a corporate standard, the diagnostic output, a diff, priority of the test and the full device information (which will be used by FULL).
As you can see, the script tells you exactly why it failed for a device:
Putting Tests Together
Once we have written our test cases, we can put them all into one main test script which we will call FULL. You remember we had a fairly pared down select in the test case - in the full tests we can add more information in.
First, import all our test cases and also import any helpers we need:
/**

 * @intent Full set of VEOS tests

 * @description Import new test cases here and add them to testList

 * We also augment the report with the region where the device is.

 */

/** --------- IMPORT TEST QUERIES HERE  --------------- **/

import "AndyM/CIS-Framework-v2/Tests/Arista VEOS/1 - AAA Server";
import "AndyM/CIS-Framework-v2/Tests/Arista VEOS/4 - AAA";
import "AndyM/CIS-Framework-v2/Tests/Arista VEOS/7 - NTP";
/** --------- IMPORT HELPERS HERE  -------------------- **/

import "AndyM/CIS-Framework-v2/Organization/regions";
Next we need to create a list of the exported functions from within each test case:
/** --------- ADD TEST FUNCTION NAMES TO testList  ---- **/

testList = one+four+seven;
Finally, produce the report. We export this function too so that it can be imported to the FULL tests:
/** DO NOT MODIFY **/
export veosTests =
  foreach test in testList
  select {
    violation: test.violation,
    reference: test.reference,
    name: test.name.name,
    comment: test.result,
    region: get_region(test.name),
    diff: test.diff,
    external_reference: test.external_reference
  };

veosTests
Running this now, we can see a full report for Arista EOS devices - you can filter by test name or region etc.
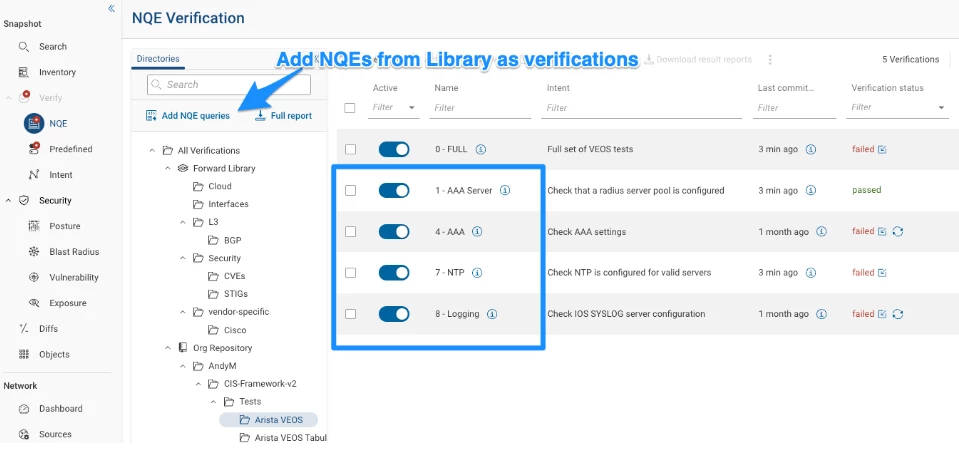
Making NQE Verifications
I’m not going to go into great detail on Verifications because this is already a long article, but the next step is to make Verifications out of the queries. Verifications run after every collection - as opposed an NQE in the library which only runs when the button is pressed.
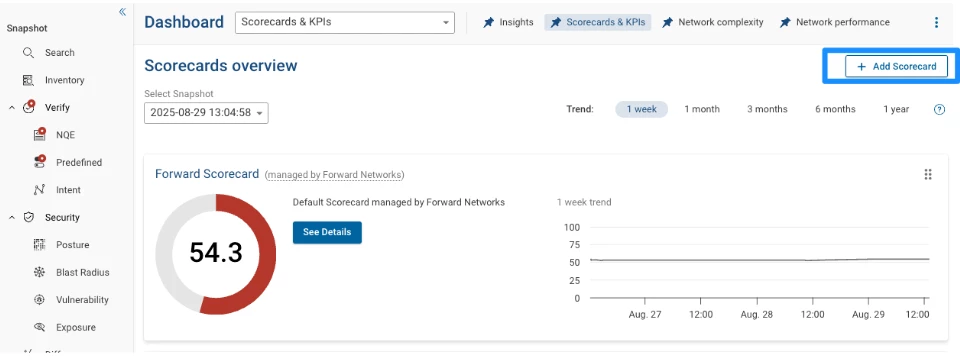
Creating Scorecards
Once the verifications are created, go to Dashboard | Scorecards
Add a new scorecard
Once created, add KPIs to the scorecard:
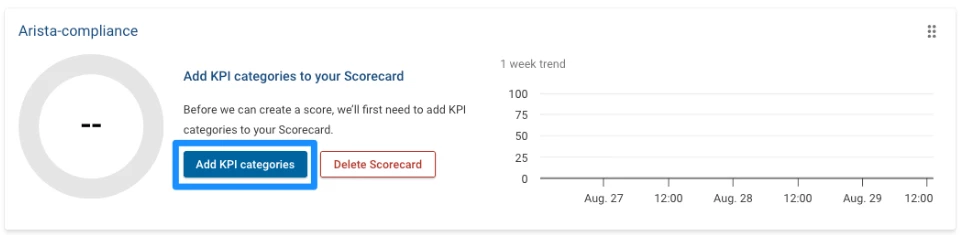
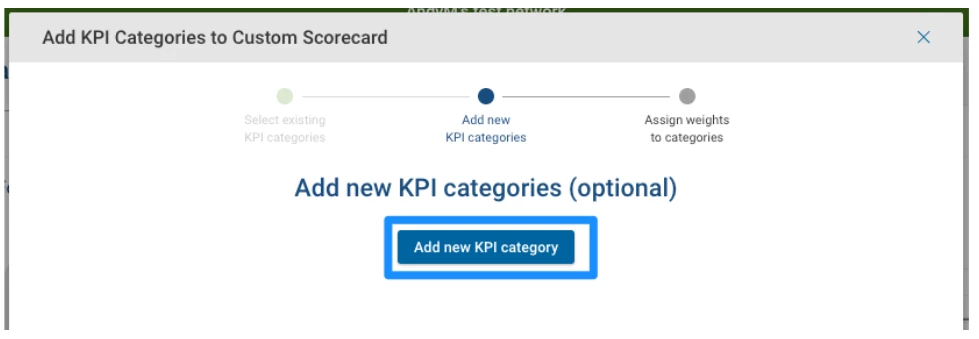
Skip the first screen and go to Add New KPI Categories
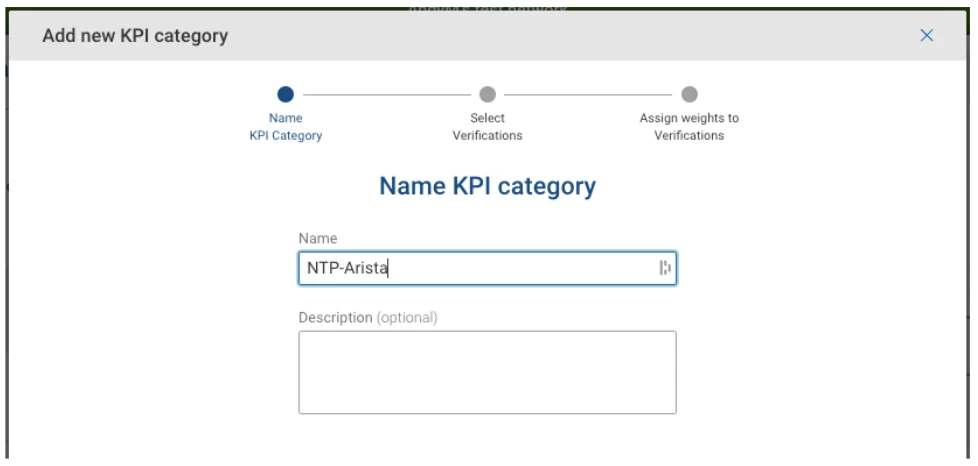
Give the KPI a unique name:
Add the Verification:
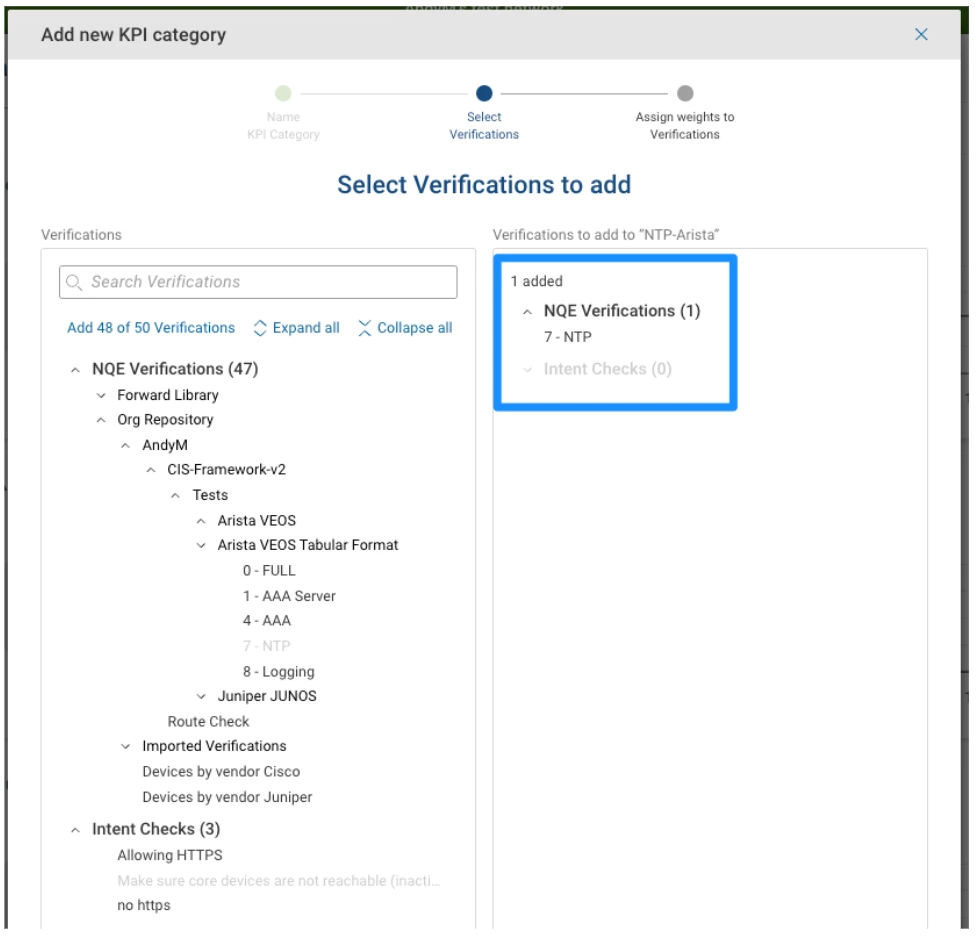
You can actually add more than one verification to a KPI, although in this example I’m not doing that. For example, you might have two NQE Verifications that are NTP-related - one for the server IP address and one for the source address - these might be grouped together in the same KPI and given different weights.
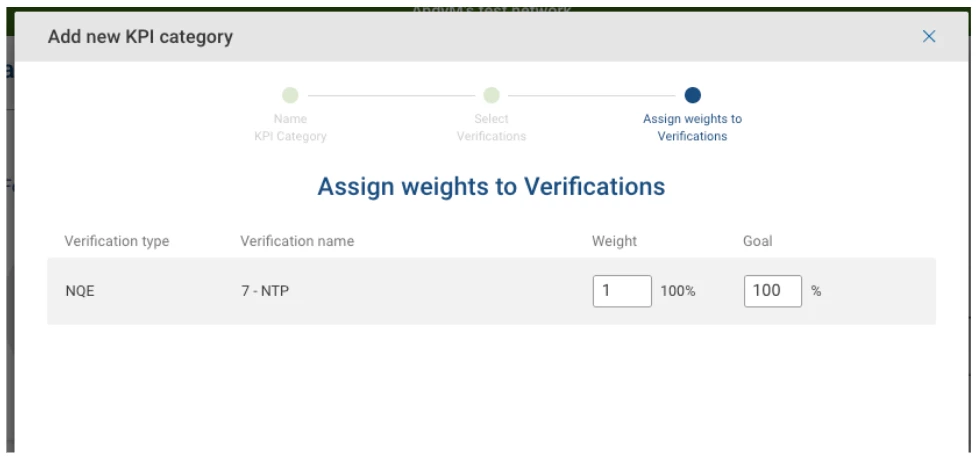
Next you can assign a weight to all the KPIs in the scorecard:
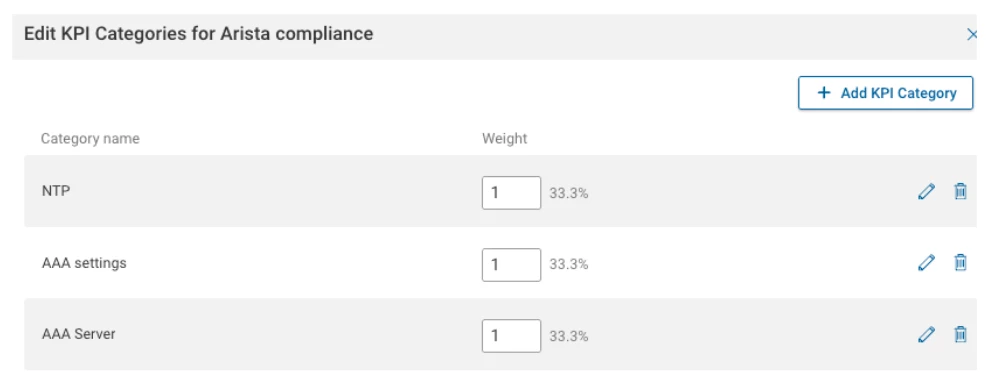
Once these KPIs are all added to your scorecard, save it and you will be presented with some clickable eye-candy.
At the top there is a summary total which also shows a trend over time so you can see your progress to 100% compliance.
Underneath are the individual KPIs with their own pie-chart showing percentage compliance. And below that is a link to the report that actually generated the numbers.
Summary
If you got to this end of the article, well done! It got a bit longer than I thought.
In this article, we looked at a test framework with lots of 'unit tests' that can be run individually, and which are then pulled into a bigger, vendor-specific test report. Finally (and optionally) you could pull all vendor tests into a monster report at the end.
Once the tests are written and published in the NQE Library, they can be made into NQE Verifications so that they run on every collection.
Finally we used the test results from the Verifications to create KPIs on a Scorecard. The Scorecard gives management-level charts, but also an operator to drill into the report underlying the chart. Being able to do this right within the platform is more powerful than exporting data somewhere else and making a dashboard there.

